Usage
Building a CliMetLab query
The WEkEO CliMetLab Plugin gives access to a wide range of WEkEO datasets. All WEkEO datasets can be explored in the WEkEO Viewer.
The CliMetLab WEkEO ECMWF Plugin supports the datasets published by ECMWF.
A dataset can be accessed using CliMatLab with the load_dataset function. The minimum required argument for the function load_dataset is the dataset id.
The CliMetLab dataset id can be derived from the dataset id inside the WEkEO viewer. For example:
WEkEO dataset id:
EO:ECMWF:DAT:REANALYSIS_ERA5_SINGLE_LEVELS_MONTHLY_MEANSCliMetLab dataset id:
wekeo-ecmwf-reanalysis-era5-single-levels-monthly-means
import climetlab as cml

ds = cml.load_dataset("wekeo-ecmwf-reanalysis-era5-single-levels-monthly-means")
This code will download all available data in this dataset. As this means the download of large volumes of data (not advised), it is necessary to further subset the query by dataset attributes. There are two ways to find the available attributes for each dataset:
Explore attributes in the WEkEO Viewer
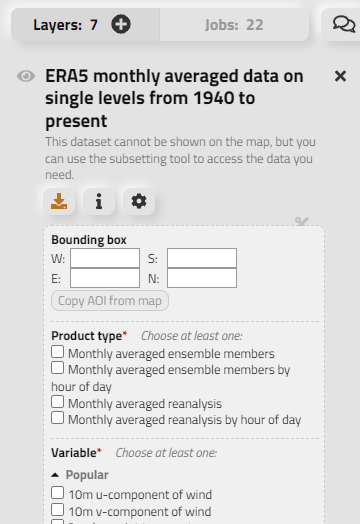
Explore attributes in the Plugin source code
Each dataset is described with its attributes in a separate python file in the plugin source code.
The above-described ERA5 dataset can be found here.
Note
Many dataset attributes are subject to selection constraints and not all combinations of attributes are possible. It is advised to check the combination of the selection in the WEkEO Viewer before creating a CliMetLab query to avoid errors of empty queries.
Now, a CliMetLab query for WEkEO data can be created:
import climetlab as cml

ds = cml.load_dataset("wekeo-ecmwf-reanalysis-era5-single-levels-monthly-means",
    product_type="monthly_averaged_reanalysis_by_hour_of_day",
    month="01",
    year="2019",
    time=[
        "00:00",
        "01:00"
    ],
    variable=[
        "2m_temperature",
        "surface_runoff"
    ],
    format_="netcdf",
)
Accessing a single dataset through CliMetLab
This query triggers the download of a subset of a single dataset.
import climetlab as cml

ds = cml.load_dataset("wekeo-ecmwf-reanalysis-era5-single-levels-monthly-means",
    product_type="monthly_averaged_reanalysis_by_hour_of_day",
    month="01",
    year="2019",
    time=[
        "00:00",
        "01:00",
        "02:00",
        "03:00",
        "04:00",
        "05:00",
        "06:00",
        "07:00",
        "08:00",
        "09:00",
        "10:00",
        "11:00",
        "12:00",
        "13:00",
        "14:00",
        "15:00",
        "16:00",
        "17:00",
        "18:00",
        "19:00",
        "20:00",
        "21:00",
        "22:00",
        "23:00"
    ],
    variable=[
        "2m_temperature"
    ],
    format_="netcdf",
)
The download result is stored in chache. Running again the cml.load_dataset for the same dataset with identical parameters will not trigger a new download, but will use the cached data instead.
After downloading, the dataset can be converted to xarray using the to_xarray function:
xarr = ds.to_xarray()
xarr
Using the python xarray module, the dataset can be analyzed and plotted.
For example, the diurnal cycle of temperature averaged across Germany can be extracted and plotted as follows:
import matplotlib.pyplot as plt

xarr.t2m.sel( lat=slice( 56, 47), lon = slice(5, 16)).mean(dim=["latitude", "longitude"]).plot.line(x="time")
plt.title ("Diurnal Temperature Cycle for Germany, Jan. 2019")

It is possible to do arithmtic operations of the differnt time steps of the dataset. Next, the temperature difference between 00:00 UTM and 12:00 UTM is shown across the globe. The temperature difference is inverted with the changing day and night cycle across the globe.
diff=xarr.t2m.isel(time=0) - xarr.t2m.isel(time=11)
diff.plot()
plt.title("Temperature Difference between 00:00 UTM and 12:00 UTM")

Working with two or more datasets using CliMetLab
In many cases it is necessary to combine more datasets and variables for data analysis. Using the WEkEO CliMetLab Plugin, datasets from different sources can be downloaded and combined. This example adds the daily temperature data from 1st January 2019 to compare it against the monthly temperature means downloaded above.
ds_daily = cml.load_dataset("wekeo-ecmwf-reanalysis-era5-single-levels",
                  product_type = "reanalysis",
                  month= "01",
                  year = "2019",
                  day = "01",
                  time=[
                      "00:00",
                      "01:00",
                      "02:00",
                      "03:00",
                      "04:00",
                      "05:00",
                      "06:00",
                      "07:00",
                      "08:00",
                      "09:00",
                      "10:00",
                      "11:00",
                      "12:00",
                      "13:00",
                      "14:00",
                      "15:00",
                      "16:00",
                      "17:00",
                      "18:00",
                      "19:00",
                      "20:00",
                      "21:00",
                      "22:00",
                      "23:00"
                  ],
                  variable = [
                      "2m_temperature"],
                  format_="netcdf",
                 )


xarr_daily = ds_daily.to_xarray()

#rename the variable to avoid having a dataset with two identical varibale names

xarr_daily =  xarr_daily.rename({'t2m': 't2m_daily')

xarr_merged = xarr.merge(xarr_daily)
import matplotlib.pyplot as plt

fig, (ax1, ax2) = plt.subplots(1,2, figsize=(15, 5))
fig.suptitle ("Comparison of difference in temperature between the daily temperatures on 01.01.2029 and the monthly means of January 2019over Germany")


xarr_full.t2m_daily.sel( latitude=slice( 56, 47), longitude = slice(5, 16)).mean(dim=["latitude", "longitude"]).plot.line(x="time", label="Daily", ax=ax1)
xarr_full.t2m.sel( latitude=slice( 56, 47), longitude = slice(5, 16)).mean(dim=["latitude", "longitude"]).plot.line(x="time", label="Montly Mean", ax=ax1)

diff = xarr_full.sel( latitude=slice( 56, 47), longitude = slice(5, 16)).t2m_daily - xarr_full.t2m
diff.isel(time=11).plot(ax=ax2)
plt.legend()

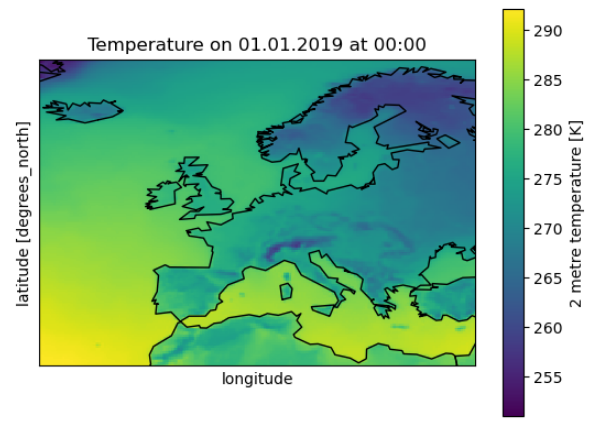
To merge datasets or to combine xarray datasets with other sources it is sometimes necessary to adapt the coordinate system or do a reprojection. If the merges dataset should be displayed together with a basemap, the longitudes have to be converted from the range [0; 360] to [-180, 180].
import matplotlib.pyplot as plt
from mpl_toolkits.basemap import Basemap

xarr_merged.coords['longitude'] = (xarr_merged.coords['longitude'] + 180) % 360 - 180
xarr_merged_reshaped = xarr_merged.sortby(xarr_merged.longitude)

xarr_europe = xarr_reshaped.sel( latitude=slice(72,30), longitude = slice(-25, 35))

m = Basemap(projection='cyl', lat_0 = xarr_europe.t2m.latitude[0], lon_0=xarr_europe.t2m.longitude[0])
m.drawcoastlines()
xarr_europe.t2m.isel(time=0).plot()
plt.title ('Temperature on 01.01.2019 at 00:00')
Handling Merge errors
The to_xarray function is not supported for all datasets depending of the datasets’ shape and variable names. In such cases the following error will occur:
Error
MergeError: Cannot safely merge your data. Try to download a single variable or loop over the files and call to_xarray on each one.
The ECMWF:SIS:WATER:HYDROLOGICAL:CHANGE dataset is one example:
ds=cml.load_dataset(
"wekeo-ecmwf-sis-water-hydrological-change",
variable=[
    "air_temperature",
    "precipitation"],
time_aggregation=["autumn", "spring"],
format_="zip",
gcm_model="esm_chem",
statistic="change_in_the_annual_mean",
experiment="rcp_8_5",
hydrological_model="pcr_globwb")

xarr.to_xarray()
This raises the error:
Error
MergeError: Cannot safely merge your data. Try to download a single variable or loop over the files and call to_xarray on each one. Original exception: conflicting values for variable ‘ref_var_threshold’ on objects to be combined. You can skip this check by specifying compat=’override’.
The original exception reveals that the datasets have identical variable names, which is why they cannot be merged to a single xarray.
The single datasets downloaded by CliMetÖab can be accessed by ds.source.sources. In a loop each dataset can be converted to xarray separetely.
import xarray as xr
datasets = [xr.open_dataset(s) for s in cmlds.source.sources]
The datasets can be merged after manually changing theit variable names using xarray.
datasets[0] = datasets[0].rename({"relative_change": "prec_relative_change"})
datasets[0] = datasets[0].rename({"ref_var_threshold": "prec_ref_var_threshold"})[['prec_relative_change', 'prec_ref_var_threshold']]

datasets[1] = datasets[1].rename({"absolute_change": "temp_absolute_change"})
datasets[1] = datasets[1].rename({"ref_var_threshold": "temp_ref_var_threshold"})[['temp_absolute_change', 'temp_ref_var_threshold']]

xarr = xr.merge(datasets)
Caching and Storage of CliMetLab datasets
The CliMetLab source module works with caching instead of storing files in the local file system. This brings the advantage that the user does not have to clean up the local disk, but the files will be removed automatically when the cache is cleared.
Warning
When working with large datasets the files will fill up the computers cache, or the data cannot be fully downloaded if the queried volume does not fit fully in cache.
For large volumes of data it is recommended to change the default location where CliMetLab stores the data from cache to a large disk or object storage. All benefits of the data management of CliMetLab remain, except the datasets are not deleted when the cache is cleared. They will be persistent on the drive instead.
import climetlab as cml

cml.settings.get("cache-directory") # Find the current cache directory

"/tmp/climetlab-$USER"

# Change the value of the setting
cml.settings.set("cache-directory", "/big-disk/climetlab-cache")

# Python kernel restarted

import climetlab as cml
cml.settings.get("cache-directory") # Cache directory has been modified

"/big-disk/climetlab-cache"
More information on caching can be found in the official documentation of CliMetLab (Caching).